
6 Graphs to Better Understand the Climate Crisis
SHARE


With so many details to get your head around, understanding the climate crisis and how we solve it can be a tricky task. Fortunately, graphs can be a huge help in connecting the dots.
So, today we’re diving into six of Climate Reality’s favorites!
THE PROBLEM: RISING TEMPERATURES
First things first, why is climate change even a problem?
The answer lies in rapidly rising average global temperatures:
Since 1880, combined land and ocean temperature has increased at an average rate of 0.07°C (0.13°F) per decade. This puts us at a little over 1°C (2°F) of warming over the past 140 years.
Notably, however, this warming is accelerating. Since 1981, the average rate of warming has risen to 0.18°C (0.32°F) per decade: more than twice the rate of the century before.
Though at first glance this might not sound like a lot, the impacts of these temperature changes are already clear. It’s been contributing to record-breaking wildfires, a record-breaking hurricane season, unprecedented sea-level rise, the spread of various mosquito-borne diseases, flooding, drought, geopolitical instability, and various other problems.
And it’s happening just about everywhere. Here’s an expanded take of the graph above:
(Image courtesy of Professor Ed Hawkins/ Reading University)
From Antigua and Barbuda at the top to Vanuatu at the bottom of the graph, the same trend is clear in countries all around the world: our planet is warming – and fast.
THE SOURCE: GREENHOUSE GAS EMISSIONS
Various greenhouse gases, such as methane and nitrous oxide, do contribute to rising global temperatures. However, coming in at 76 percent of global greenhouse gas emissions (based on emissions from 2010), carbon dioxide is the primary culprit:
(Image courtesy of NASA)
As the infamous “hockey stick” graph above shows, the concentration of carbon dioxide in our atmosphere today, about 410 ppm (parts per million), is a level unseen for millions of years.
For reference, atmospheric CO2 levels have risen over the past 60 years about 100 times faster than previous natural increases, such as those that occurred at the end of the last ice age 11,000-17,000 years ago.
So, where exactly is this carbon dioxide and other greenhouse emissions coming from?
(Image courtesy of the US EPA)
As the graph above shows, global greenhouse gas emissions come from many sectors and aspects of our lives (based on data from 2010):
· Electricity and heat production: 25%
· Agriculture, forestry, and other land use: 24%
· Industry: 21%
· Transportation: 14%
· Other energy uses (such as fuel extraction, refining, processing, and the transportation of fuel): 10%
Knowing where emissions come from gives us clear targets to aim at when thinking about where and how we need to change if we want to stop rising temperatures.
THE SOLUTION: THE FALLING COST OF RENEWABLE ENERGY
So, we know what the problem is, and why it’s happening. But how do we solve it?
Let’s start by looking at the price of different energy sources.
Why? Because the use of fossil fuels for energy (think electricity, heat, and transportation) is the primary contributor of greenhouse gas emissions worldwide.
In 2018, for example, CO2 emissions from fossil fuel combustion for energy were equal to “about 75% of total U.S. anthropogenic GHG emissions (based on 100-year global warming potential) and about 93% of total U.S. anthropogenic CO2 emissions”, according to the US Energy Information Administration.
Thus, transitioning over to clean, renewable energy is vital to solving the climate crisis.
And critical to achieving that goal is unlocking renewable energy that’s as cheap, reliable, and abundant as fossil fuels.
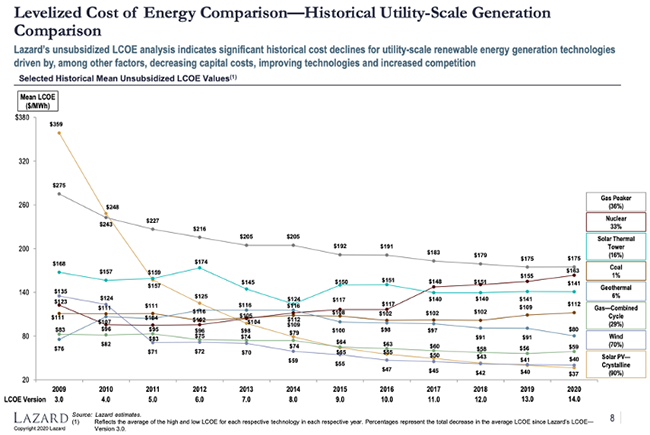
(Image courtesy of Lazard, Levelized Cost of Energy 14.0)
The good news?
Today, we already can largely power our economies and our lives with cheap, clean, low-emissions energy sources like wind, solar, and geothermal. In just a decade, these sources have made unprecedented strides, constantly plummeting in price to the point where they’re now economically competitive with fossil fuels.
In fact, this year, IEA (the International Energy Agency) said that solar is now the cheapest electricity in history. Similarly, wind energy growth over the past decade has been staggering and its price has made it an increasingly viable choice all around the world.
A global just transition to clean energy alone isn’t enough to solve the climate crisis. But it’s a huge step in that direction and now that we can power our lives without destroying the planet and polluting communities, all for the same cost or cheaper as using fossil fuels, there’s no reason not to get moving.
THE ROAD AHEAD: OUR REMAINING CARBON BUDGET
Knowing the causes, effects, and solutions to the climate crisis, one clear question remains: How much time do we have? Or, more specifically, how much more carbon can we safely put in our atmosphere?
The following visual provides a clear answer to that question:
This is what it’s all about. And yet, basically no one has even seen these figures. We need to communicate this everywhere over and over again. Let’s get started. https://t.co/x30t5QGVGA
— Greta Thunberg (@GretaThunberg) December 13, 2019
As it (and the global scientific community) suggests, we have until 2030 — less than 10 years — to cut our emissions in half. After that, science suggests we have at most until 2050 to bring global emissions down to zero.
This is how we can avoid surpassing the Paris Agreement’s infamous 1.5 degrees of warming threshold. Established by the IPCC (Intergovernmental Panel on Climate Change), the world’s leading body of climate scientists, this is the mark at which our planet risks facing the most catastrophic effects of the climate crisis.
Without question, every fraction of a degree of warming matters. We must keep pushing the movement for solutions forward.
STAY UPDATED ON THE CLIMATE CRISIS AND ITS SOLUTIONS
Want to see more great graphics, stories, and other creative ways to tell and share the story of climate change? If so, start following Climate Reality on Twitter, Facebook, or Instagram!
Alternatively, we welcome you to sign up for our email activist list. We’ll keep you up to date on the latest developments on the climate crisis and how you can get involved in the movement for solutions!